Climate Data (Energy Evaluation)
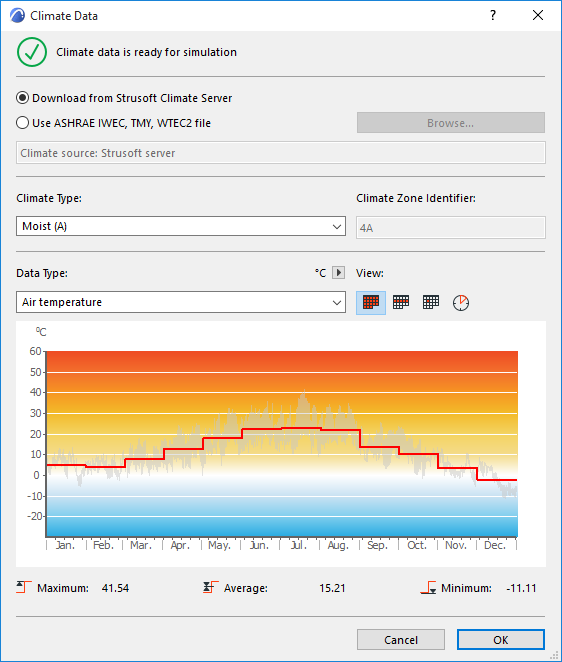
Open this dialog box from the Model Review Palette’s pop-up at the top right; or from Design > Energy Evaluation > Climate Data; or from the Environment Settings dialog box.

Climate Data Source
Choose an option for the source of the climate data to be used for Energy Evaluation.
•Download from StruSoft Climate Server. All StruSoft climate data are created from NCEP Reanalysis data provided by the NOAA-CIRES Climate Diagnostics Center, Boulder, Colorado, USA, from their website at http://www.cdc.noaa.gov/.
•Use ASHRAE IWEC, TMY, WTEC2 file: Click Browse to select and import data from analytic weather files obtained from an external source (from open source e.g.
https://energyplus.net/weather, or purchased)
Note: Use analytic (“ideal year”) weather data whenever possible, as it usually represents a given location's climate better than climate data recorded in any particular year.
Once the weather data are assigned to a certain project, they are stored in the ARCHICAD Cache Library, so the data remain available when opening another ARCHICAD project later, even if the computer is not online.
Climate Type
It is possible to assign a Climate Type that best describes that of the building location: Moist, Dry or Marine. This classification is necessary for compliance with certain North American Building Energy Efficiency Calculation Standards, but it has no effect on the calculation result.
View Climate Data
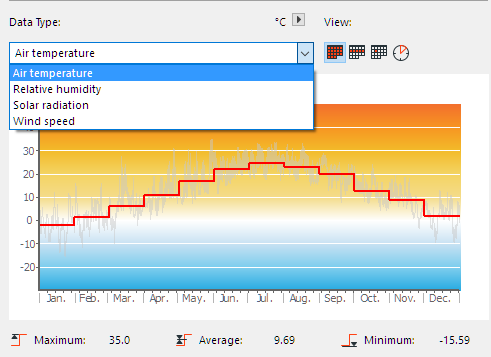
The chart below graphically illustrates climate fluctuation over the course of one year. Choose the climate data type that you want to see in the chart: either Air Temperature, Relative humidity, Solar radiation or Wind speed.

Use the four icons at right to choose the level of detail you want to view: by month, day, week or hour.
|
|
|
|
Air Temp monthly |
Air Temp weekly |
|
|
|
|
Air Temp daily |
Air Temp hourly |
Below the graph, the maximum, average and minimum values for the chosen climate data type are listed.

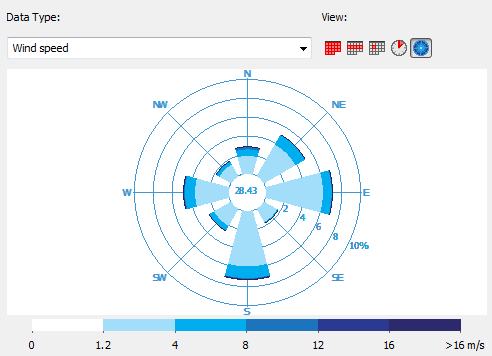
If Wind speed is selected as visualized climate data type, an additional icon is also available, which displays the wind data in wind-rose form.

The polar diagram represents the 8 main directions. The length of each segment represents how often (as a percentage, over the course of a year) the wind blows from the given direction.
Each color within a segment represents a wind speed range (as a percentage of the total wind from that direction), in accordance with the color scheme below.
The value at the center of the wind-rose (the white area) represents the percentage of time that the wind is nonexistent or negligible.