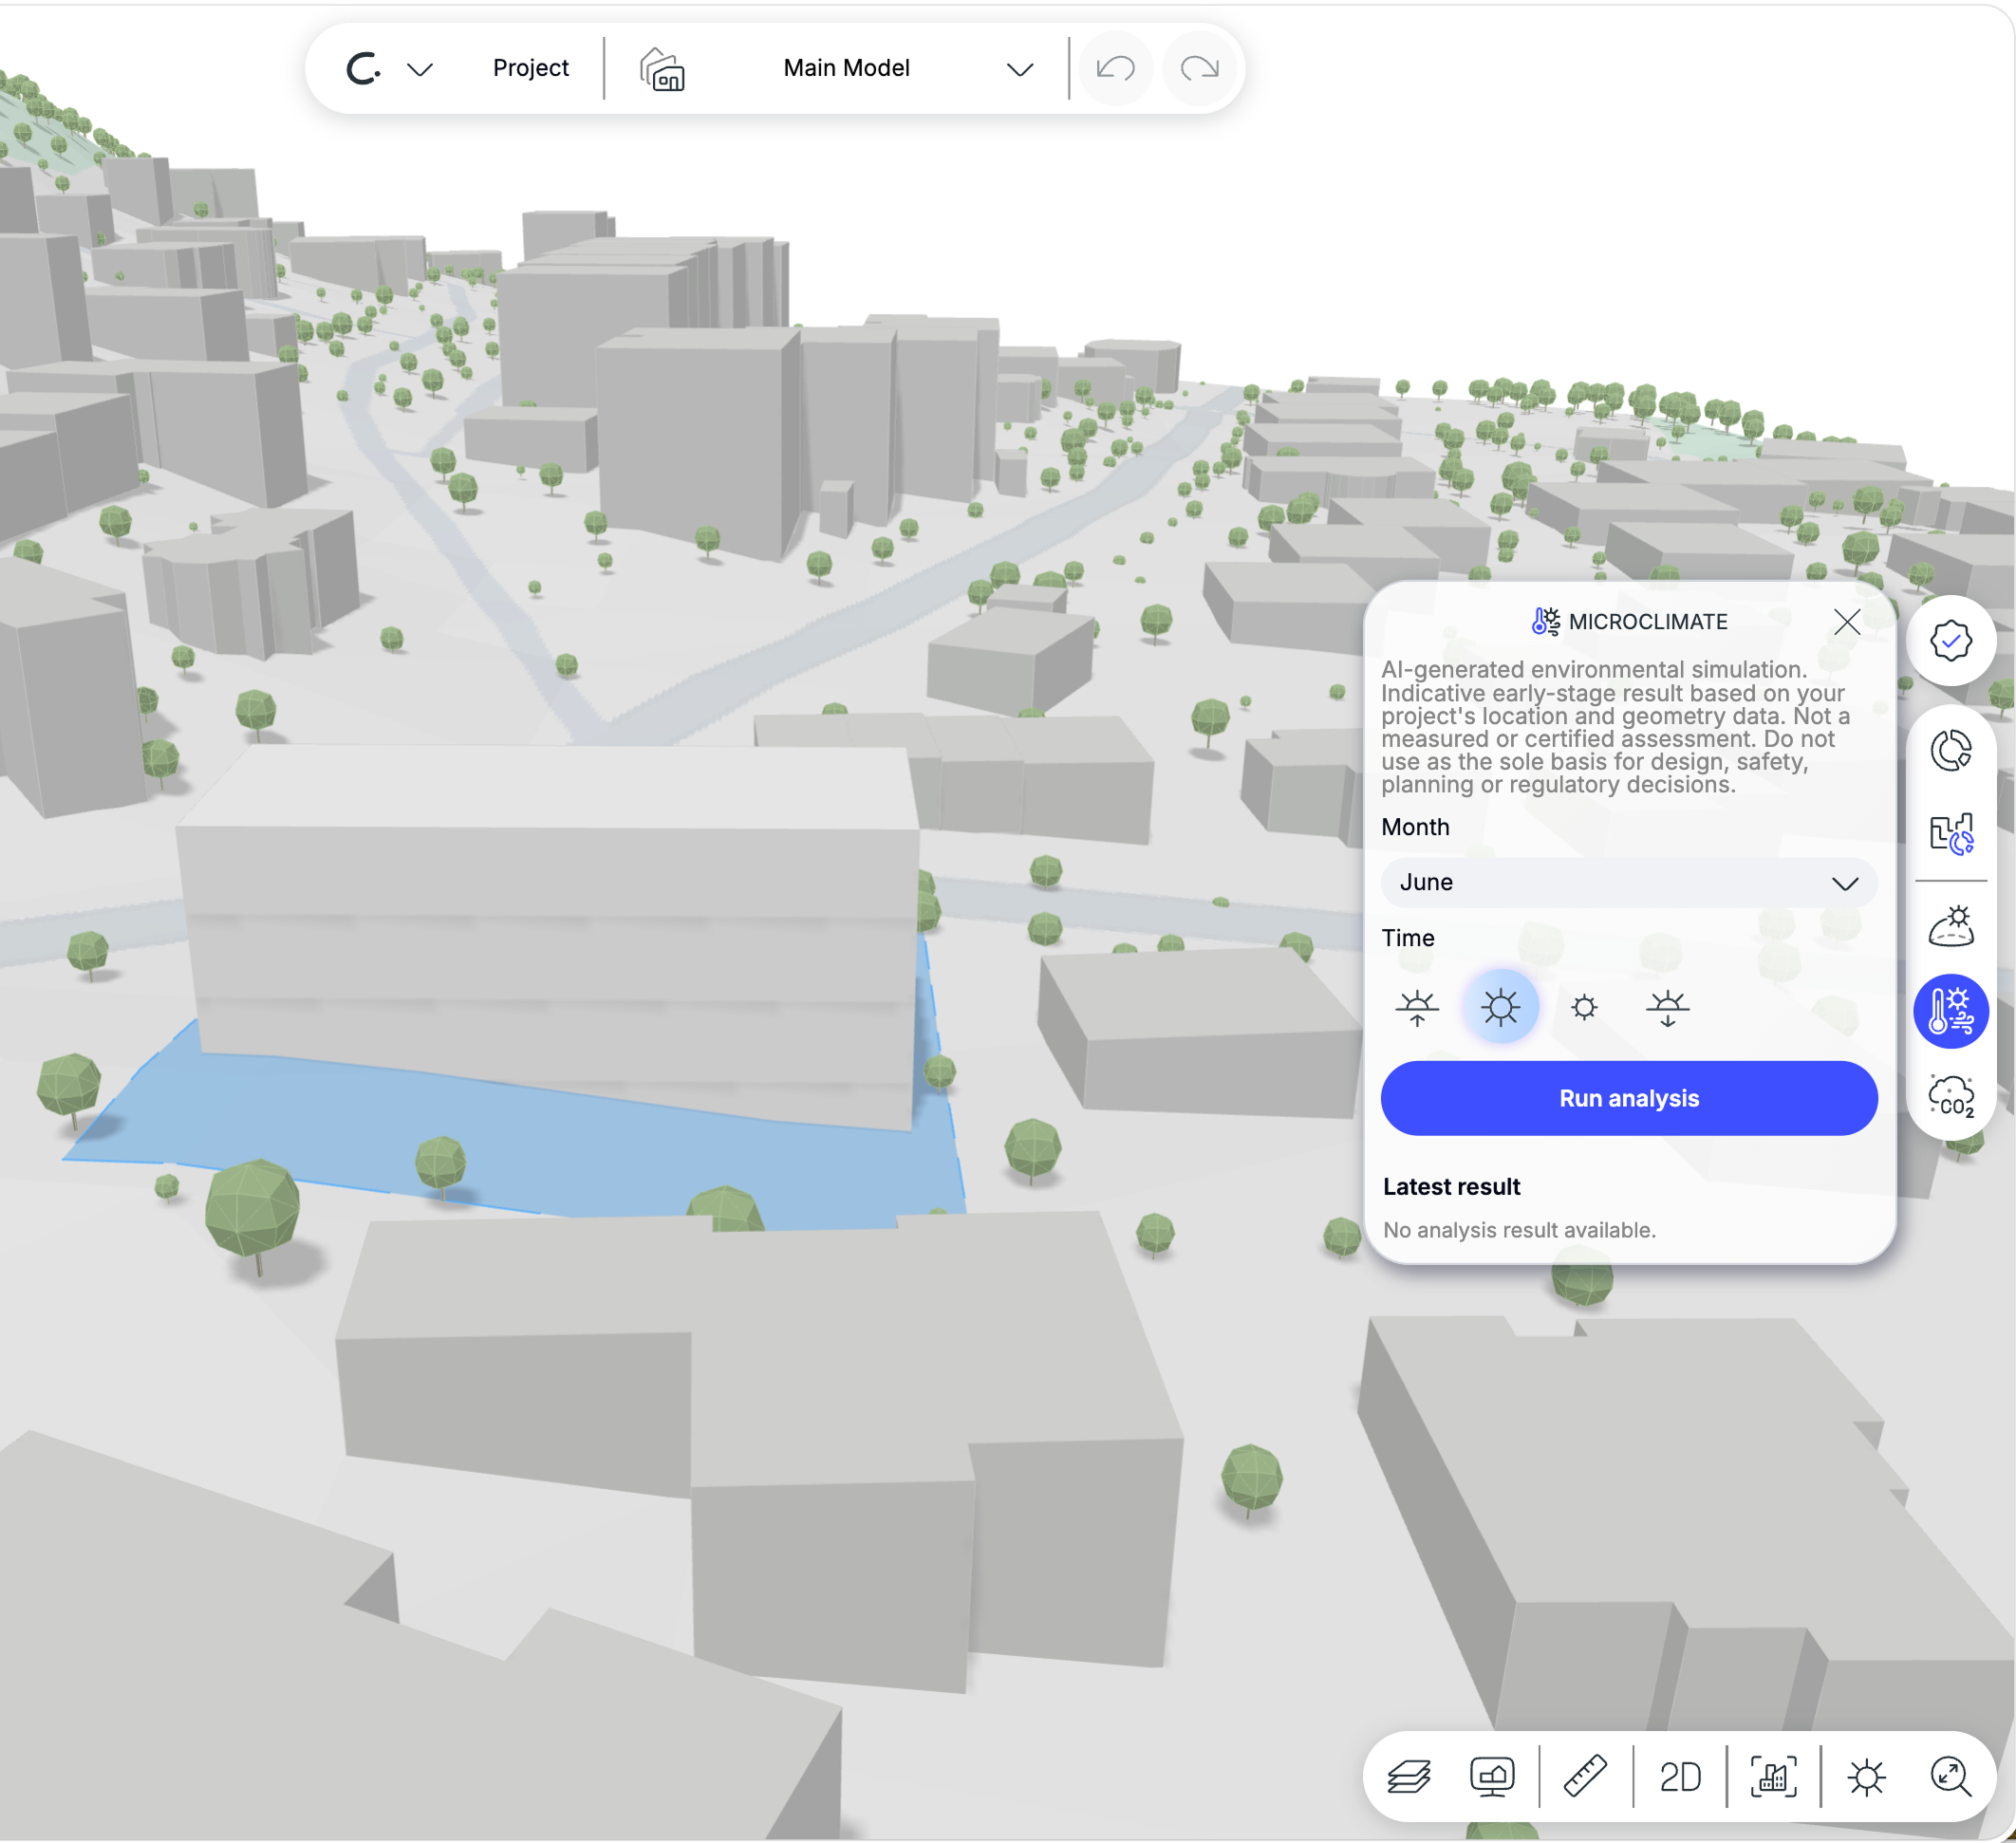
Microclimate Analysis
Microclimate AnalysisMicroclimate Analysis shows outdoor thermal comfort for a selected month and time range, based on the UTCI (Universal Thermal Climate IndexUniversal Thermal Climate Index). Creator displays the results as a model heatmap and a chart of thermal-stress categories.
Run a Microclimate Analysis
Read the results
The heatmap and chart show UTCI temperature buckets: No thermal stress is green, approximately 9 °C to 26 °C; higher values indicate heat stress, and lower values indicate cold stress. Shaded areas around buildings and trees are often more comfortable in summer.
Units and Analysis History
To change temperature display, open Main menu → Settings → Units & DecimalsUnits & Decimals and select Celsius (°C) or Fahrenheit (°F). Completed analyses are saved in the analysis history with the design buildings used at the time of the run.