Wind Analysis
Wind Analysis creates a wind speed simulation that helps you understand how your building mass and surrounding context influence airflow across your site.
You select a wind direction and reference wind speed, and the simulation shows how that wind is accelerated, slowed down, or redirected as it interacts with your proposed geometry. Use it during early design to compare massing options, identify areas of stronger or weaker airflow, and understand how your design may affect entrances, public spaces, courtyards, pedestrian routes and outdoor areas.
The Wind Direction value describes where the wind comes from: 0° is wind from the north, 90° from the east, 180° from the south, and 270° from the west. The Wind Speed represents the wind condition before it is affected by your building and the surrounding geometry. It is defined at 10 m above ground in an open-field condition.
This is an indicative early-stage simulation, not a measured or certified wind assessment.
Before you begin
- Make sure the model contains at least one design Building.
- Check the accuracy of your building context. Nearby buildings, especially those upwind, shelter or channel the wind, strongly affecting the results. Add or edit surrounding structures if they are missing or inaccurate.
- Look up typical wind conditions for the project location, for example from a local weather station to get the usual wind direction and speed.
Run a Wind Speed Analysis
- Open the project in the Master Modeler.
- Make sure the model contains at least one design building.
- Open
Wind AnalysisWind Analysison the right side of the interface. - Set the Wind
directiondirectionin degrees, or manually change it in the compass rose. - Enter the reference
wind speedwind speedfor that scenario, expressed in m/s. - Click
Run AnalysisRun Analysis. - Compare different massing options - Keep the same wind conditions when comparing designs so you can see how changes in your geometry affect airflow.
Read the results
The color map shows the simulated wind speed across the analyzed area.
Remember: the wind speed you entered is the starting condition. The values shown in the result can be higher or lower because the wind interacts with your building and surrounding context.
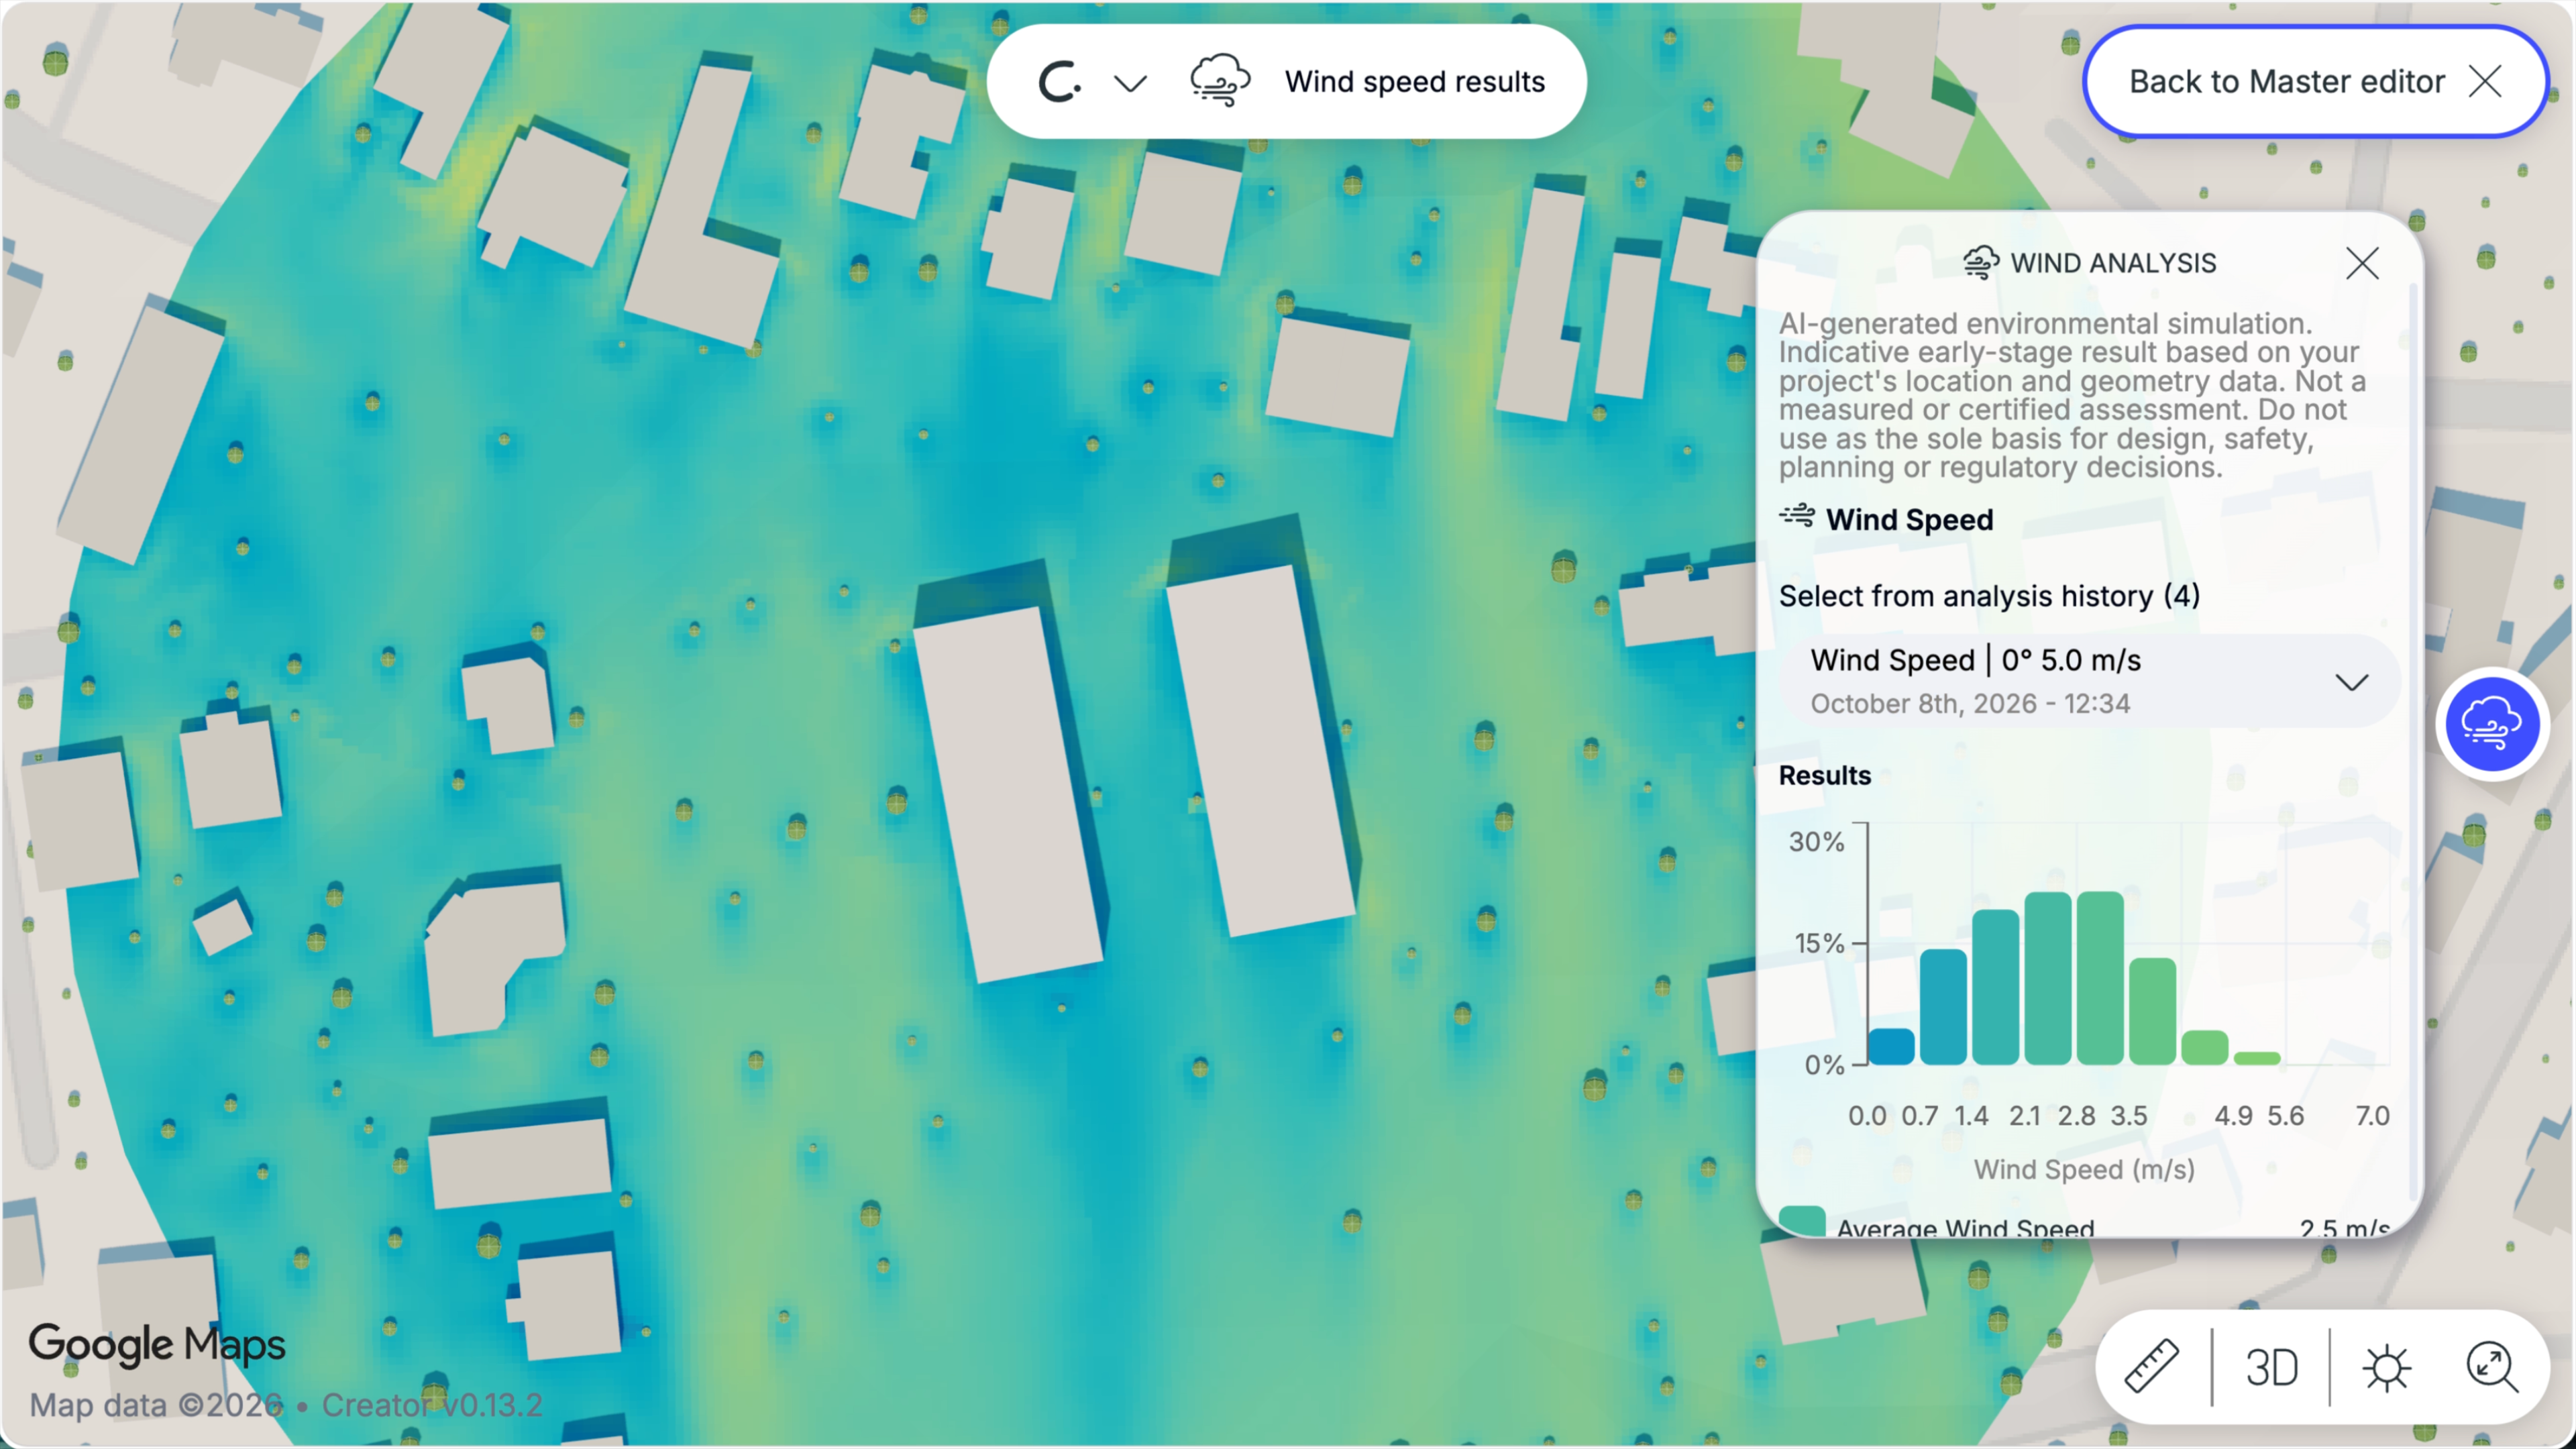
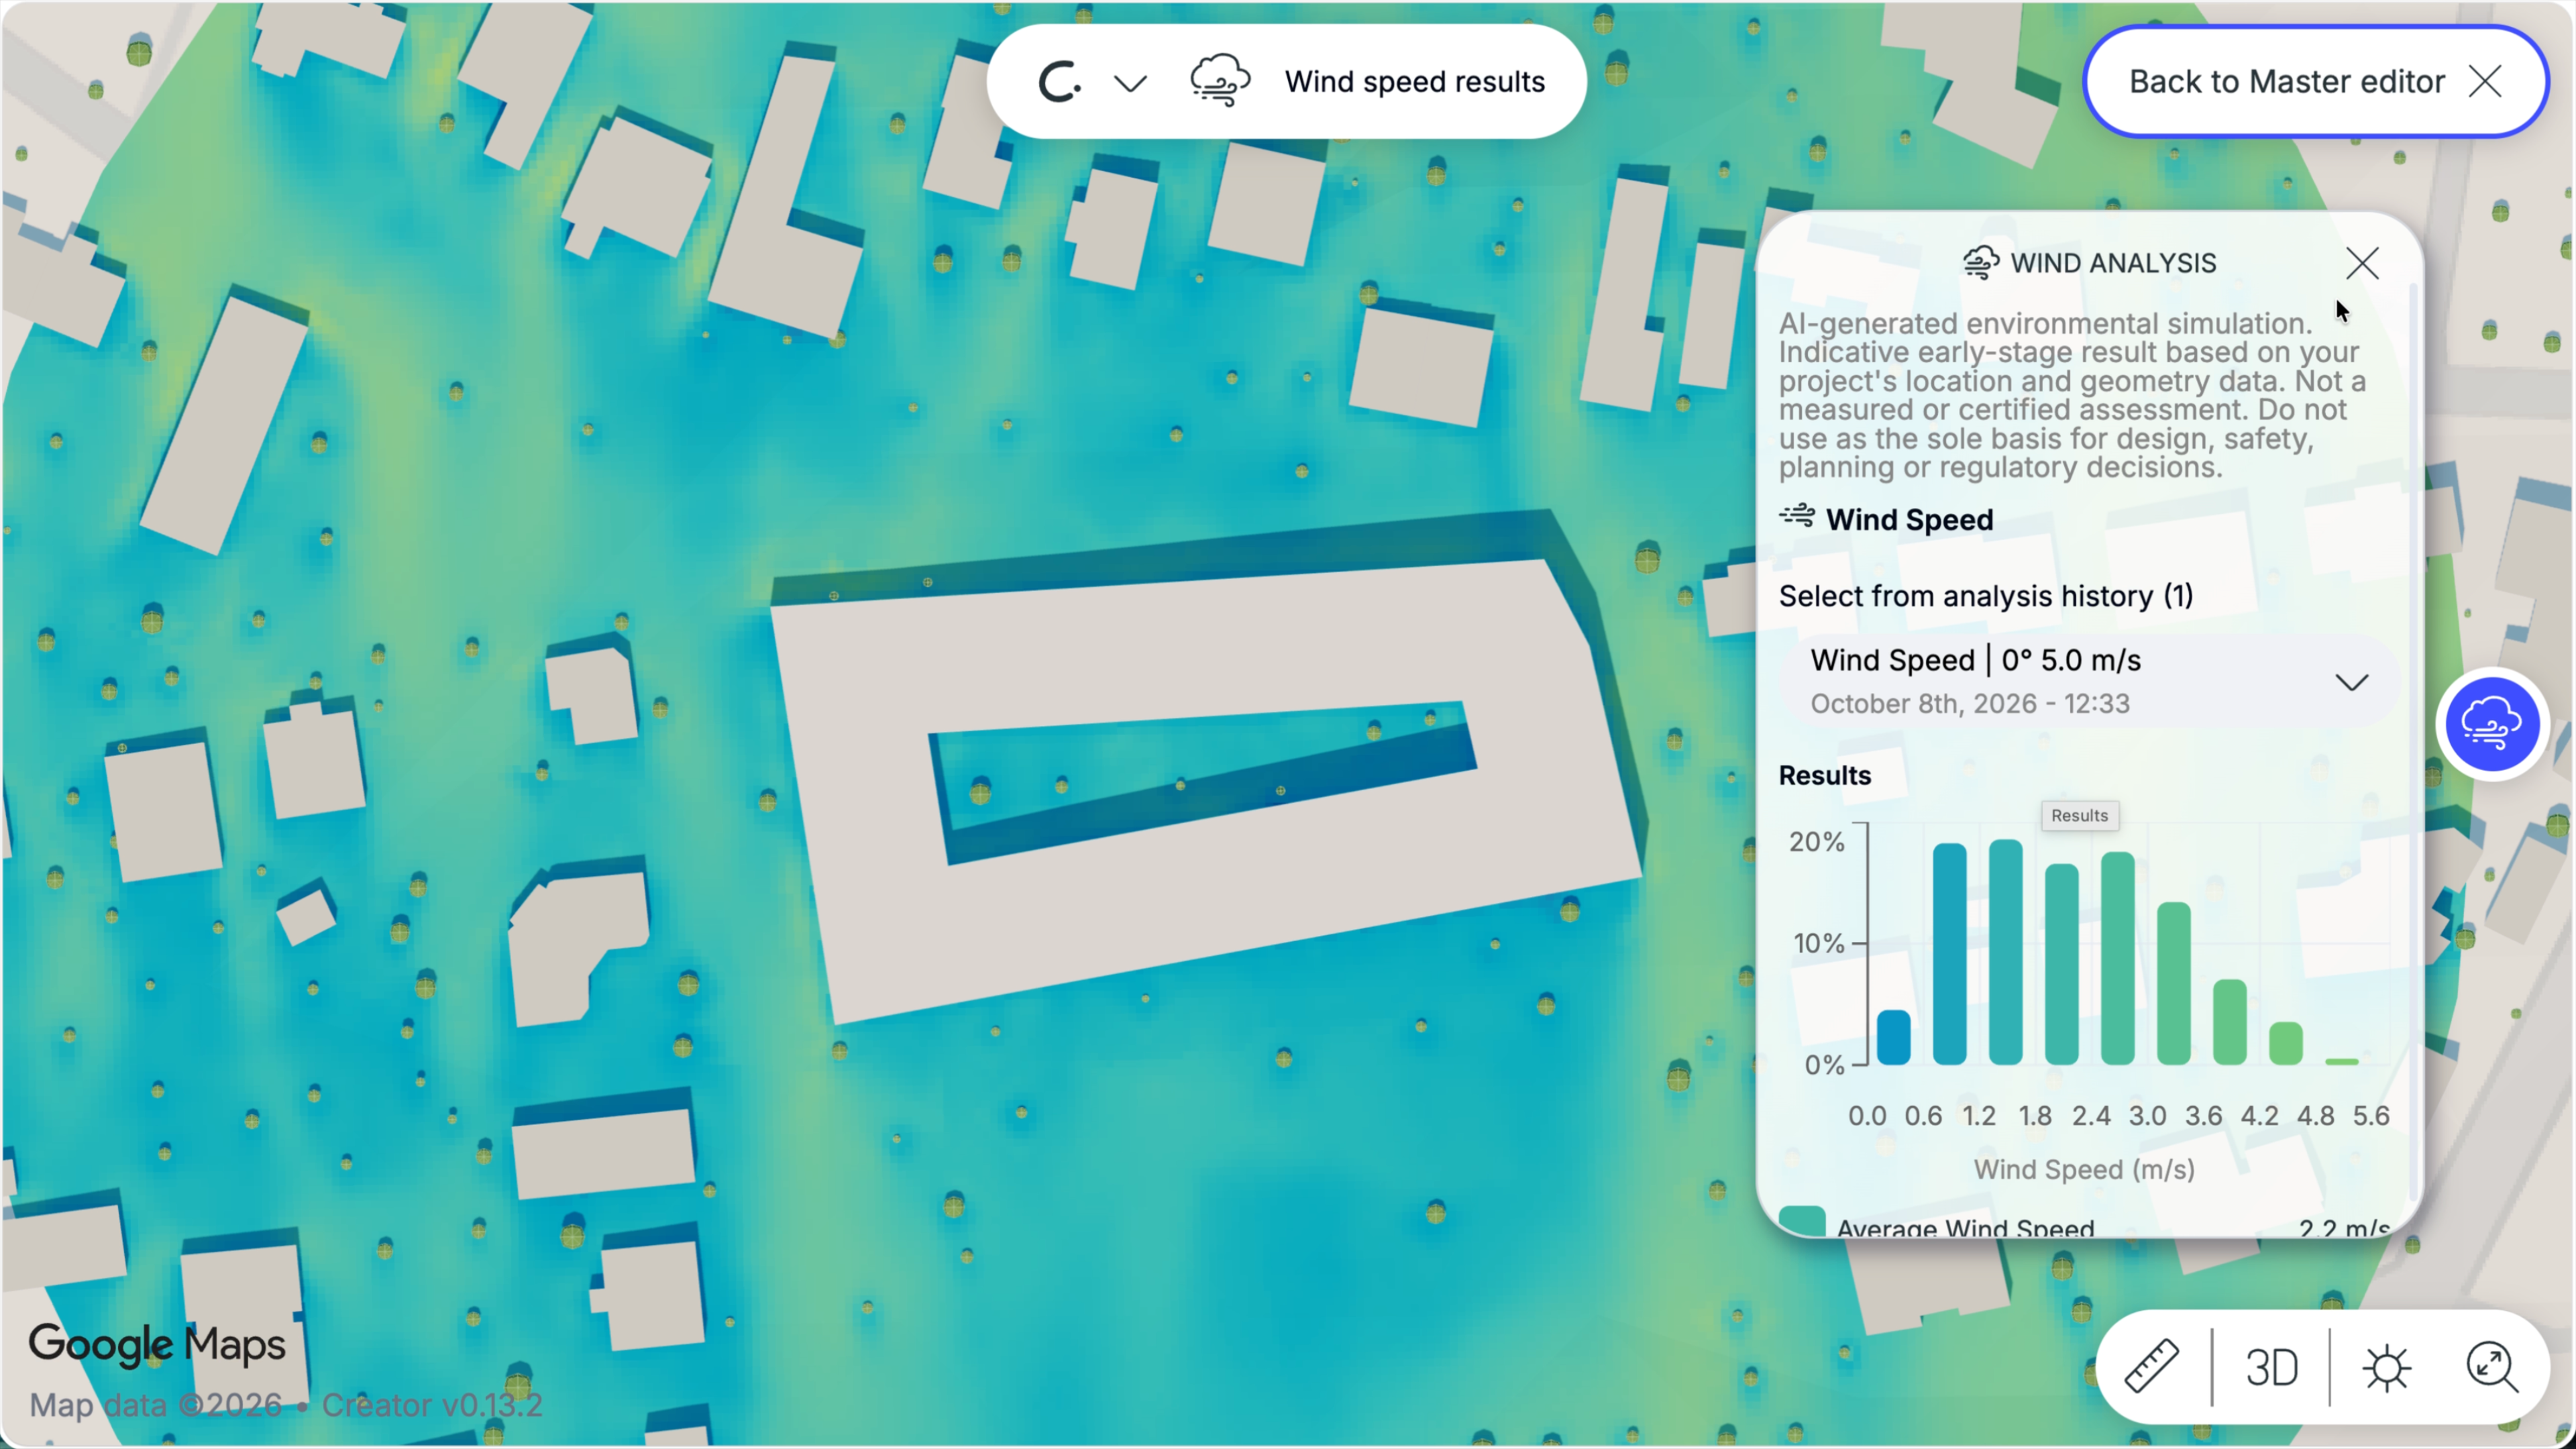
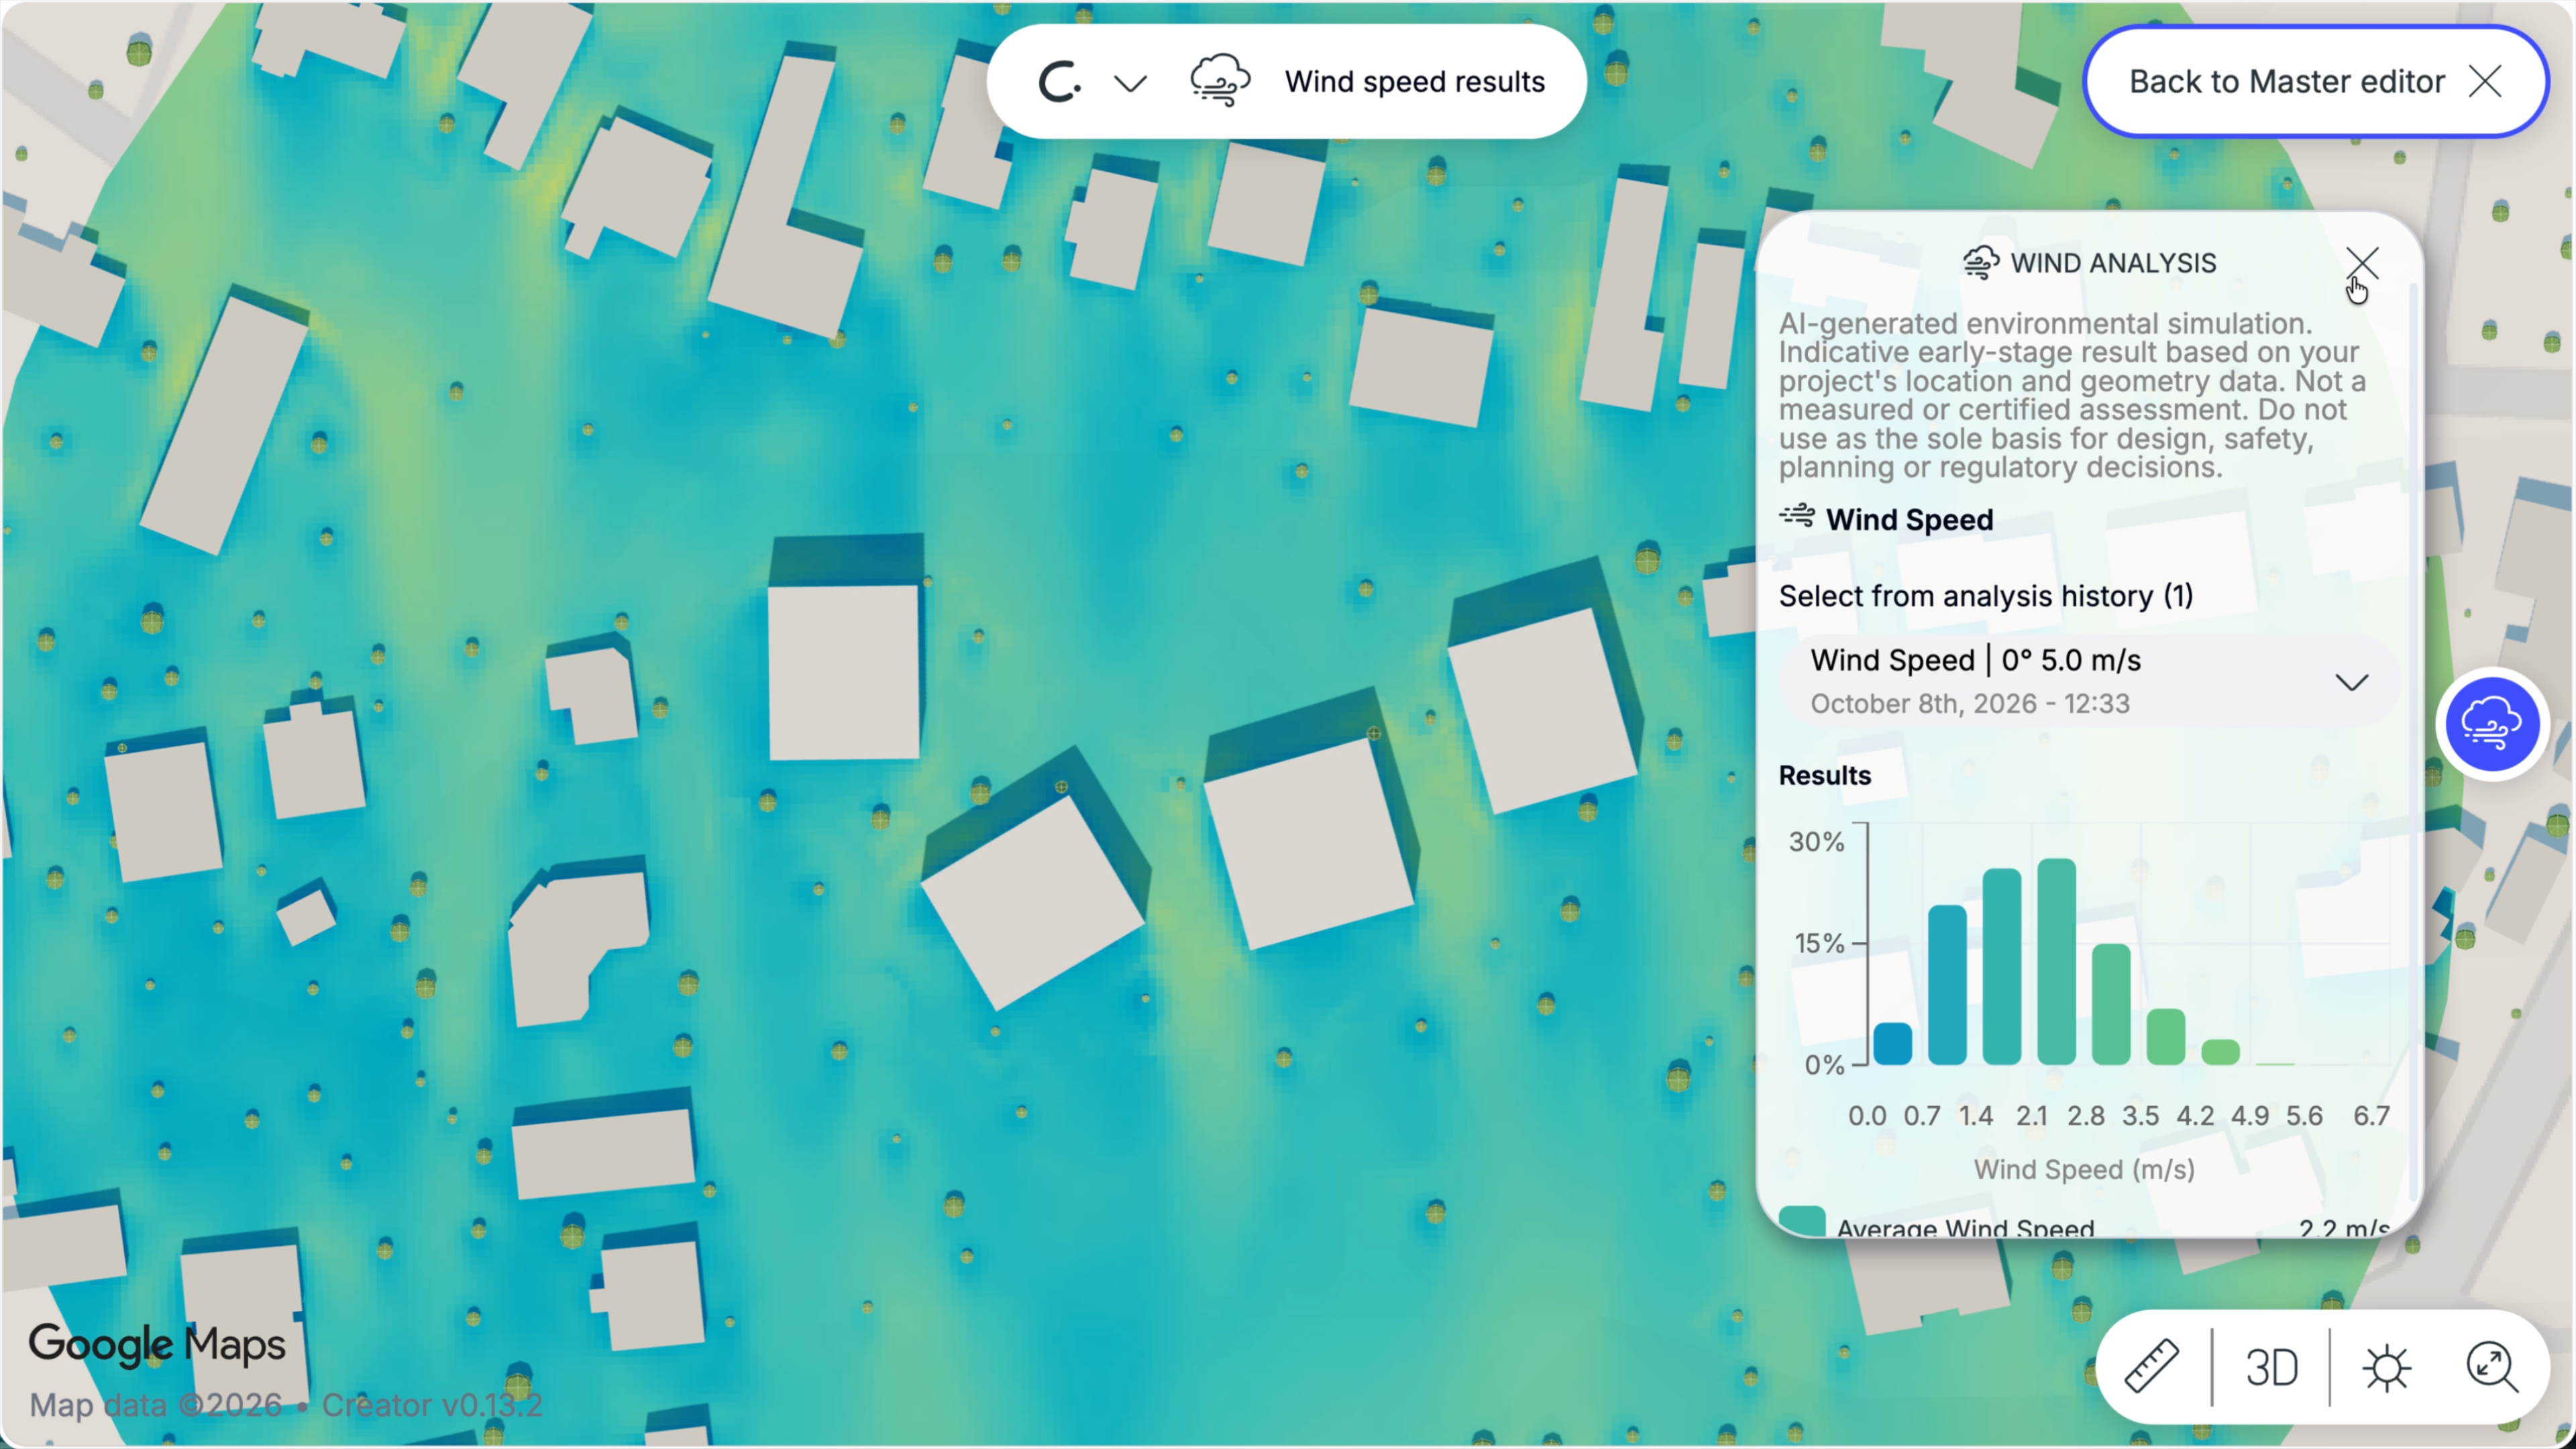
Higher-speed areas
These can occur around:
Units and Analysis History
The analyses are saved in the analysis history with the design buildings used at the time of the run.