Note: You must be a Server Administrator to use this function.
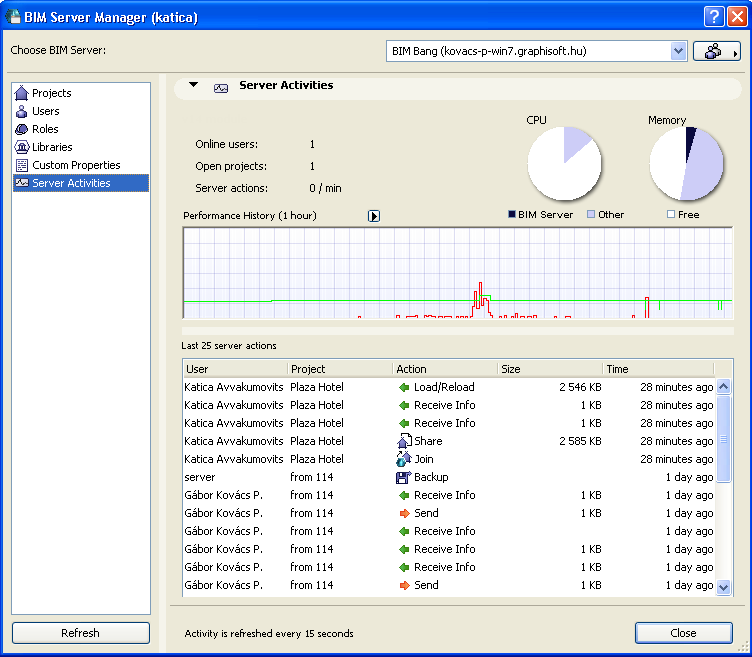
The Server Activities page of the BIM Server Manager provides feedback on the performance of the server computer and the BIM Server application (BIM Server modules 14 and later). This page gives you a picture of the server’s current status, and also provides a recent history of server-related events.
Use this page to answer such questions as:
•Does the server have enough resources (CPU, memory) to run all these projects? How often are 100% of the available resources in use?
•Is this a good time to apply a hotfix to the server?
•What caused the server logjam last night at 5 pm?
The Server Activities page of BIM Server Manager shows aggregate information for all Teamwork projects on the server.
Note: To monitor user-specific, server-related activity for a particular project, go to the “Currently joined users” section of Project Settings (Teamwork > Project > Teamwork Project Settings.)
See Monitor User Activity by Project.
Open the Server Activities Dialog Box
1.Open the BIM Server Manager.
2.Click on Server Activities to access this page.
Refreshing Data on the Server Activities Screen
Data on the Server Activities page are refreshed every 15 seconds. Occasionally, the server is so busy that you will have to wait longer for the update. If the refreshed data is still pending, you will see a “waiting for refresh” alert (or “last refreshed 30s ago”) at the bottom right corner of the Server Activities panel.
View Basic Server Data
At the top of this page, relevant data are listed:
•the server module whose data are displayed (if one of your modules is v13. Otherwise, data from all server modules (e.g. 14 and 15) are displayed.)
•the number of users on the BIM Server who are currently online and actively working on the project.
•the number of projects on the BIM Server that are currently open.
Note: Even if all users have closed the project, the server may count it as open for a while.)
•the current average number of user actions (by all users, on all open projects) per minute
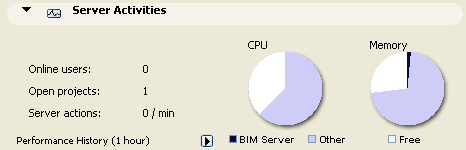
To the right, two pie charts provide at-a-glance feedback
•the current CPU usage, by the BIM Server and by other applications on the server machine
•the relative amount of memory currently used:
-by the BIM Server, and
-by “other” applications on the server machine.
Performance History Graph
The BIM Server’s Performance History graphs the server’s activity level over time, with each graph line based a different data type, to help you monitor what the server has been doing recently.
Remember, data is refreshed every 15 seconds.
Customize Data in Performance Graph
Customize the graph to show the data you need:
1.History Length: Choose the time unit represented in the Performance History graph: click History Length from the pop-up list, then choose the desired time interval (here, one hour).
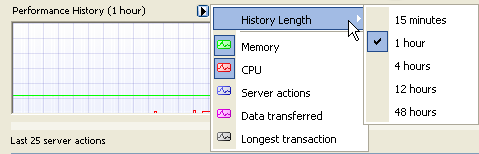
If you plan to monitor server performance on a continuous basis, the “15 minutes” interval is most useful. To check activity over the last day or two, use the other time units.
2.Choose the data types you wish to display from the pop-up list. Click any item to toggle it on or off; each displayed data type is represented by a different color in the graph:
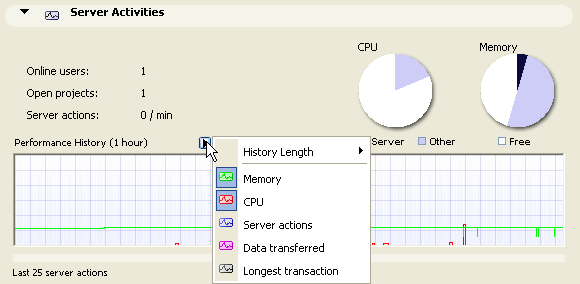
Memory and CPU: These graph lines (green and red, respectively) indicate the percentage of the machine’s total CPU and Memory capacity (in other words, every time the red line spikes to the top of the graph, you are reaching the CPU processing limit.)
Server actions: This graph line reflects the activities of the BIM Server only (not any other server application on the machine). (These activities are the same ones listed on the bottom half of the Server Activities page, under “Last 25 Server Actions”.)
This (blue) graph line indicates a relative quantity: if the BIM Server performs a high number of actions within the 15-second interval, the blue line is relatively high; if the server is inactive, the line is shorter. When you view the performance history as a whole, the highest point of the blue line shows you the point when the highest number of server actions occurred, during the given history length (e.g. during the past one hour).
Data transferred: This (purple) graph line also indicates a relative quantity: if a relatively large amount of data is transferred between the server and its clients, within the 15-second interval, the purple line is relatively high. When you view the performance history as a whole, the highest point of the purple line shows you the point at which the largest-sized data transaction occurred, within the given history length (e.g. during the past one hour).
Longest Transaction: This (grey) graph line displays the length of the longest server transaction completed during the 15-second interval. When you view the performance history as a whole, the highest point of the grey line shows you the point at which the most time-consuming data transaction occurred, within the given history length (e.g. during the past one hour).
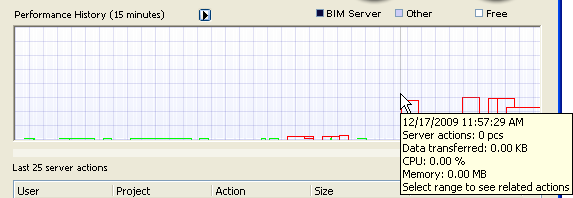
Hover the cursor over any part of a graph line (for example, at an unusual spike in CPU usage) to see information on server activity at the time the spike occurred.
View Last 25 Server Actions
Use the list of “Last 25 server actions” to monitor the server’s recent activity.
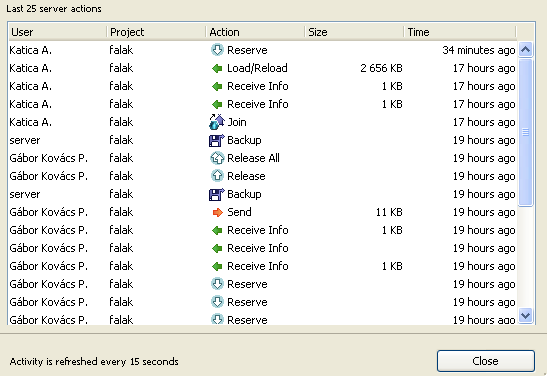
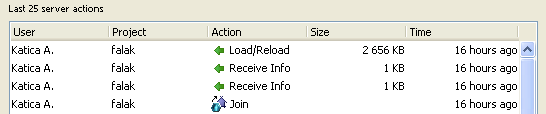
Note that single user action (such as “Join”) may entail multiple server actions. Here, a single Join by the user has registered four server actions: Join, Receive Info (twice) and Load/Reload.
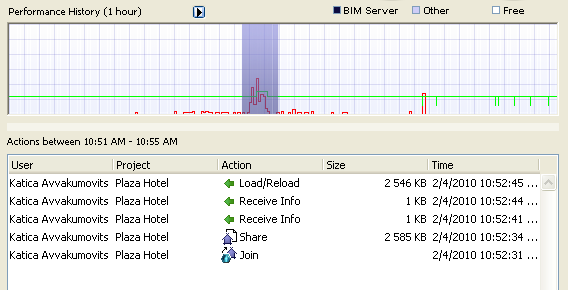
View Server Actions over Selected Time Interval
Click and drag the cursor over any interval on the graph: the BIM server actions of the selected time interval will be displayed in the list below:
To revert to the list showing the last 25 server actions, click again in the Performance Graph to undo the selection.